You send 500 cold emails, wait a few days, and check your campaign dashboard. There are some opens, a handful of replies, and perhaps one person interested in learning more.
Is that a good result?
It depends on who you contacted, what you offered, and how many of those replies could realistically turn into customers.
Cold email response rates are often discussed as if every campaign should reach the same percentage. In reality, a campaign targeting carefully selected SaaS founders can perform very differently from one targeting thousands of businesses across multiple industries.
The number also doesn't tell you whether people are interested. A campaign can generate plenty of replies without producing a single qualified sales conversation.
In this guide, we'll look at what cold email response rates actually mean, how current benchmarks compare, how to calculate your own results, and what to investigate when a campaign isn't performing as expected.
The goal isn't to chase an arbitrary percentage. It's to understand whether your outreach is reaching the right people and creating meaningful business opportunities.
What Is a Cold Email Response Rate?
Cold email response rate measures the percentage of recipients who respond to your outreach.
A common way to calculate it is:
Cold Email Response Rate = (Unique Replies ÷ Delivered Emails) × 100
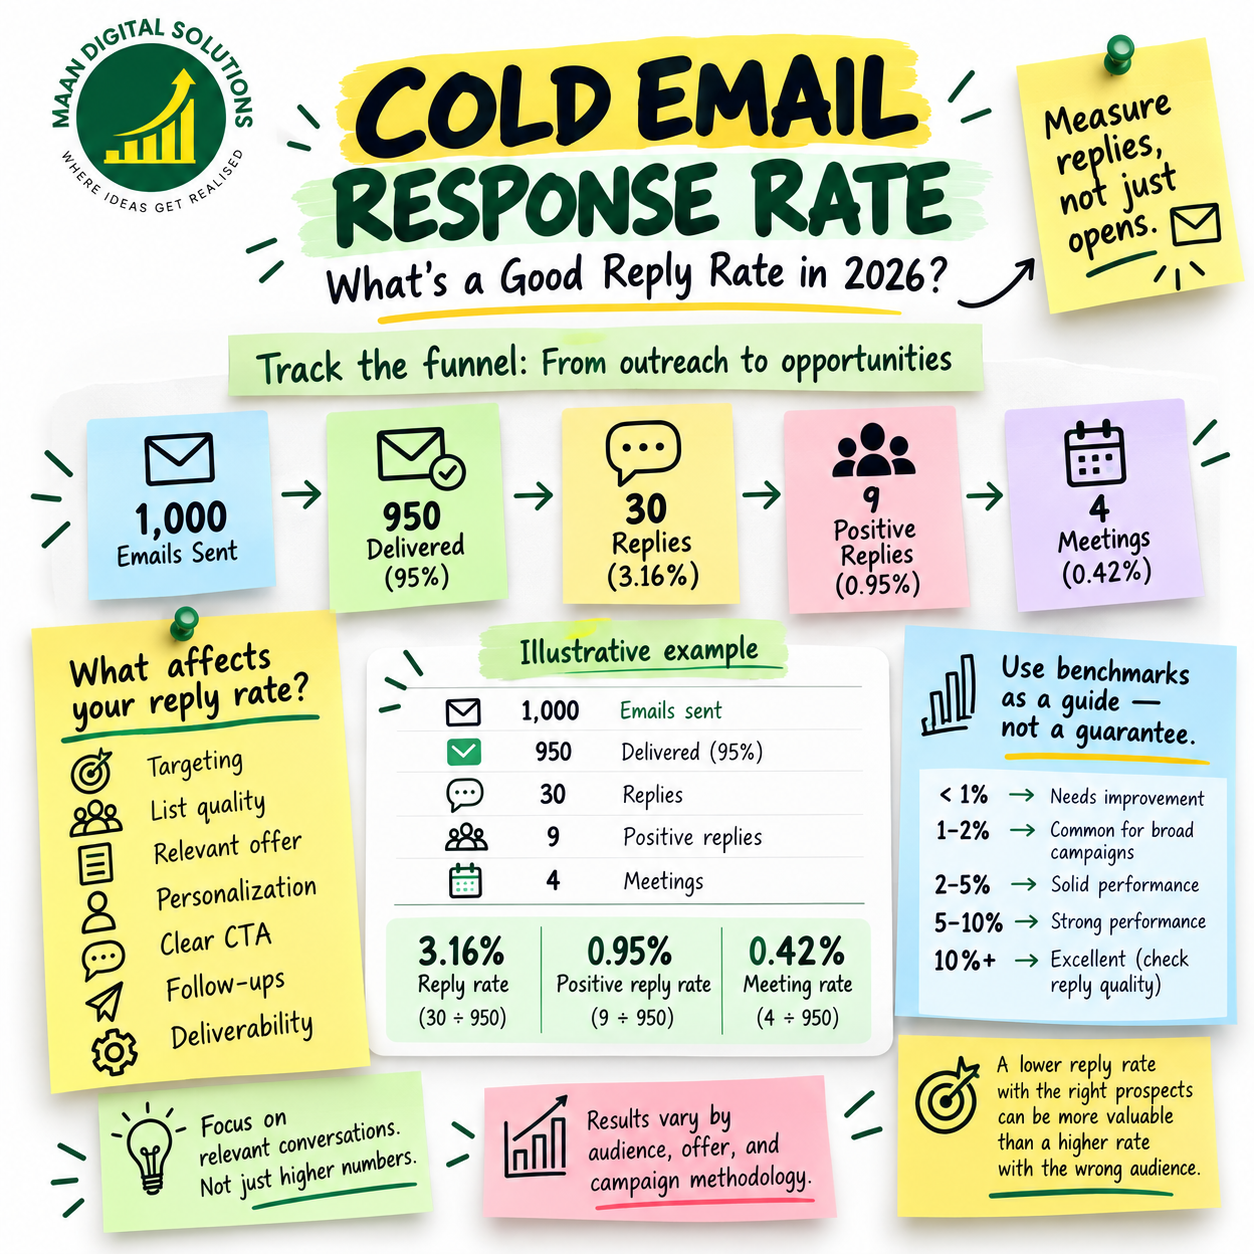
For example, imagine you send 1,000 cold emails and 950 are delivered. If 30 recipients reply, your response rate is:
30 ÷ 950 × 100 = 3.16%
This calculation assumes you're counting unique recipient replies and excluding automated responses, such as out-of-office messages. It's important to define what counts as a reply before comparing campaigns.
Some email platforms calculate response rates using emails sent rather than delivered. Others report results across an entire sequence, including follow-ups. These differences can make two campaigns appear to perform differently even when their underlying results are similar.
For reliable reporting, use the same calculation for every campaign you compare.
What Is a Good Cold Email Response Rate in 2026?
There isn't one response rate that guarantees a successful cold email campaign.
Published benchmarks offer useful reference points, but the results vary according to the data source, campaign size, sending practices, and measurement method.
For example, Woodpecker's cold email benchmark report, updated on August 5, 2026, reports a 1.5% median reply rate across 56,614 campaigns in its latest 90-day dataset.
Woodpecker also reports that smaller campaigns often achieve higher median reply rates than larger campaigns. Independent companies in its dataset recorded a 2.7% median for campaigns targeting 0–50 prospects, compared with 1.2% for campaigns targeting 1,001–5,000 prospects.
Its separate cold email statistics report, updated in June 2026, reports a 3.43% platform-wide average reply rate across a much larger historical dataset.
These figures measure different things: one is a median from a recent period, while the other is a platform-wide average. They shouldn't be treated as interchangeable.
As a practical starting point, you can interpret your results like this:
| Reply rate | What to investigate |
|---|---|
| Below 1% | Check targeting, list quality, deliverability, and the offer |
| 1–2% | Compare performance with similar campaigns and look for improvements |
| 2–5% | Assess whether replies are relevant and producing qualified conversations |
| 5–10% | Examine what is working and whether the results remain consistent |
| Above 10% | Check reply quality, audience fit, and how the rate was calculated |
These are working guidelines, not universal industry standards. A 2% reply rate from highly qualified decision-makers may be more valuable than a 7% rate dominated by negative responses.
The better question is whether your campaign is generating the conversations your business needs.
Why There Is No Universal Good Reply Rate
Consider two campaigns targeting potential customers for a B2B software service.
Campaign A
-
Delivered emails: 1,000
-
Total replies: 30
-
Positive replies: 12
-
Qualified meetings: 5
Campaign B
-
Delivered emails: 1,000
-
Total replies: 65
-
Positive replies: 4
-
Qualified meetings: 1
Campaign B has a reply rate of 6.5%, while Campaign A has a rate of 3%.
If you look only at total replies, Campaign B appears to be the winner. But Campaign A generated more qualified meetings.
That difference matters because the purpose of B2B cold email isn't simply to encourage people to respond. It's to start relevant conversations with potential customers.
A campaign's performance depends on several factors:
-
How closely the prospects match your ideal customer profile
-
Whether the offer addresses a relevant problem
-
The accuracy of your contact data
-
The quality of the message
-
The relevance of personalization
-
Email deliverability
-
The follow-up sequence
-
The quality of the resulting conversations
This is why comparing your campaign with a general industry average can only tell you so much.
Reply Rate vs. Positive Reply Rate
One of the easiest mistakes in cold email reporting is treating every reply as a positive result.
Imagine you contact 1,000 prospects and receive 40 replies.
Those responses might include people expressing interest, declining the offer, asking to be removed from your list, or explaining that you're contacting the wrong person.
Your total reply rate is 4%, but that doesn't mean 4% of your prospects are interested.
It's useful to track several separate metrics.
Total reply rate
The percentage of delivered emails that receive a reply under your chosen measurement rules.
Positive reply rate
The percentage of delivered emails that receive a genuinely interested or potentially interested response.
Qualified conversation rate
The percentage of delivered emails that lead to conversations with prospects who fit your target market and have a plausible business need.
Meeting rate
The percentage of delivered emails that result in a booked meeting.
Using the earlier example, suppose 950 emails are delivered, 40 people reply, 12 express interest, and 5 meetings are booked.
Your results would be:
-
Total reply rate: 4.21%
-
Positive reply rate: 1.26%
-
Meeting rate: 0.53%
These figures tell a much more useful story than the total reply rate alone.
When measuring positive replies, use a consistent definition. For example, someone asking for more information might count as positive, while an explicit rejection would not.
How Many Replies Can You Expect From 100, 500, or 1,000 Emails?
It's easier to understand response rates when you translate percentages into actual numbers.
The following examples assume every email in the calculation was delivered.
| Delivered emails | At 1% | At 3% | At 5% |
|---|---|---|---|
| 100 | 1 reply | 3 replies | 5 replies |
| 500 | 5 replies | 15 replies | 25 replies |
| 1,000 | 10 replies | 30 replies | 50 replies |
| 5,000 | 50 replies | 150 replies | 250 replies |
These are mathematical illustrations, not forecasts. Actual results can vary substantially, and replies won't necessarily represent qualified prospects.
Sending more emails can increase the number of responses, but it doesn't automatically improve the percentage of people who reply.
Woodpecker's recent benchmark data shows a relationship between campaign size and median reply rate. Its independent-company cohort recorded a 2.7% median for campaigns of up to 50 prospects and 1.2% for campaigns of 1,001–5,000 prospects.
This doesn't prove that small campaigns always perform better. It does suggest that expanding a campaign without maintaining targeting quality can come at a cost.
Rather than increasing volume immediately, first understand which audience and message are producing the strongest results.
What Affects Your Cold Email Response Rate?
When replies are lower than expected, the problem may not be the email copy itself. Several parts of the campaign deserve attention.
1. Your target audience
A campaign aimed at everyone who might theoretically buy your service is difficult to make relevant.
For example, targeting all business owners in the United States gives you a very broad audience. A campaign targeting US-based SaaS companies with 10–50 employees and an established sales team has a clearer focus.
The narrower audience gives you more context for deciding what problem to address and why the recipient might care.
Start with your ideal customer profile. Consider industry, company size, geography, business model, role, and the conditions that make a prospect a good fit.
A smaller, well-defined audience is often easier to research and communicate with than a broad list of loosely related businesses.
2. Prospect list quality
Incorrect or outdated contact information creates problems before your message has a chance to work.
Your list may contain:
-
Invalid email addresses
-
Contacts who have changed jobs
-
Incorrect job titles
-
Companies outside your target market
-
Duplicate records
-
Generic inboxes when a specific decision-maker is needed
-
Prospects who have no clear connection to your offer
List quality also affects deliverability. A campaign with a high number of bounced emails has a data-quality problem that rewriting the subject line won't fix.
Email verification can help identify invalid or risky addresses before sending. However, verification is not a guarantee that an email will reach the inbox or that the recipient will respond.
3. Your offer
Sometimes the message is clear, the contact details are accurate, and the email reaches the recipient—but the offer still isn't compelling.
Consider the difference between these two statements:
"We provide digital marketing services."
"We help B2B IT companies build a more consistent pipeline through targeted outbound campaigns."
The first describes a service. The second explains the business outcome the service is intended to support.
A good offer gives the prospect a reason to consider the conversation. It should be relevant to their business, understandable without extensive explanation, and realistic about what you can deliver.
4. Personalization
Personalization can help a message feel relevant, but inserting a first name into a generic email isn't enough on its own.
Useful personalization reflects something about the recipient's actual situation.
Depending on the campaign, that might include their industry, product, market, role, company size, or a relevant business development.
For example, an IT agency owner and a SaaS founder may both care about acquiring customers, but their sales processes and challenges can be different.
Your message should reflect that difference instead of using exactly the same pitch for both audiences.
5. Subject line and opening sentence
The subject line gives the recipient an initial indication of what the email concerns. The opening sentence should then provide context that supports the subject rather than introducing an unrelated pitch.
Avoid trying to manufacture curiosity with misleading claims. A subject line that attracts attention but doesn't match the email can damage trust.
Keep the opening focused on why you're contacting that particular person and why the topic is relevant.
6. Email length
A cold email doesn't need to explain your entire service offering.
The recipient should be able to understand the reason for the message without working through several paragraphs of company background.
Keep the message focused on the prospect, the relevant problem or opportunity, and the next step you're proposing.
Shorter isn't automatically better, though. A message that is so brief that it provides no context may be just as ineffective as an unnecessarily long one.
7. Deliverability
A message cannot generate a reply if it never reaches the recipient's inbox.
Authentication, domain reputation, sending practices, bounce rates, and spam complaints all deserve attention.
Google's email sender guidelines explain the importance of email authentication and maintaining appropriate sending practices.
If deliverability is poor, don't try to compensate by sending more emails. Investigate the underlying issue before increasing volume.
8. Follow-ups
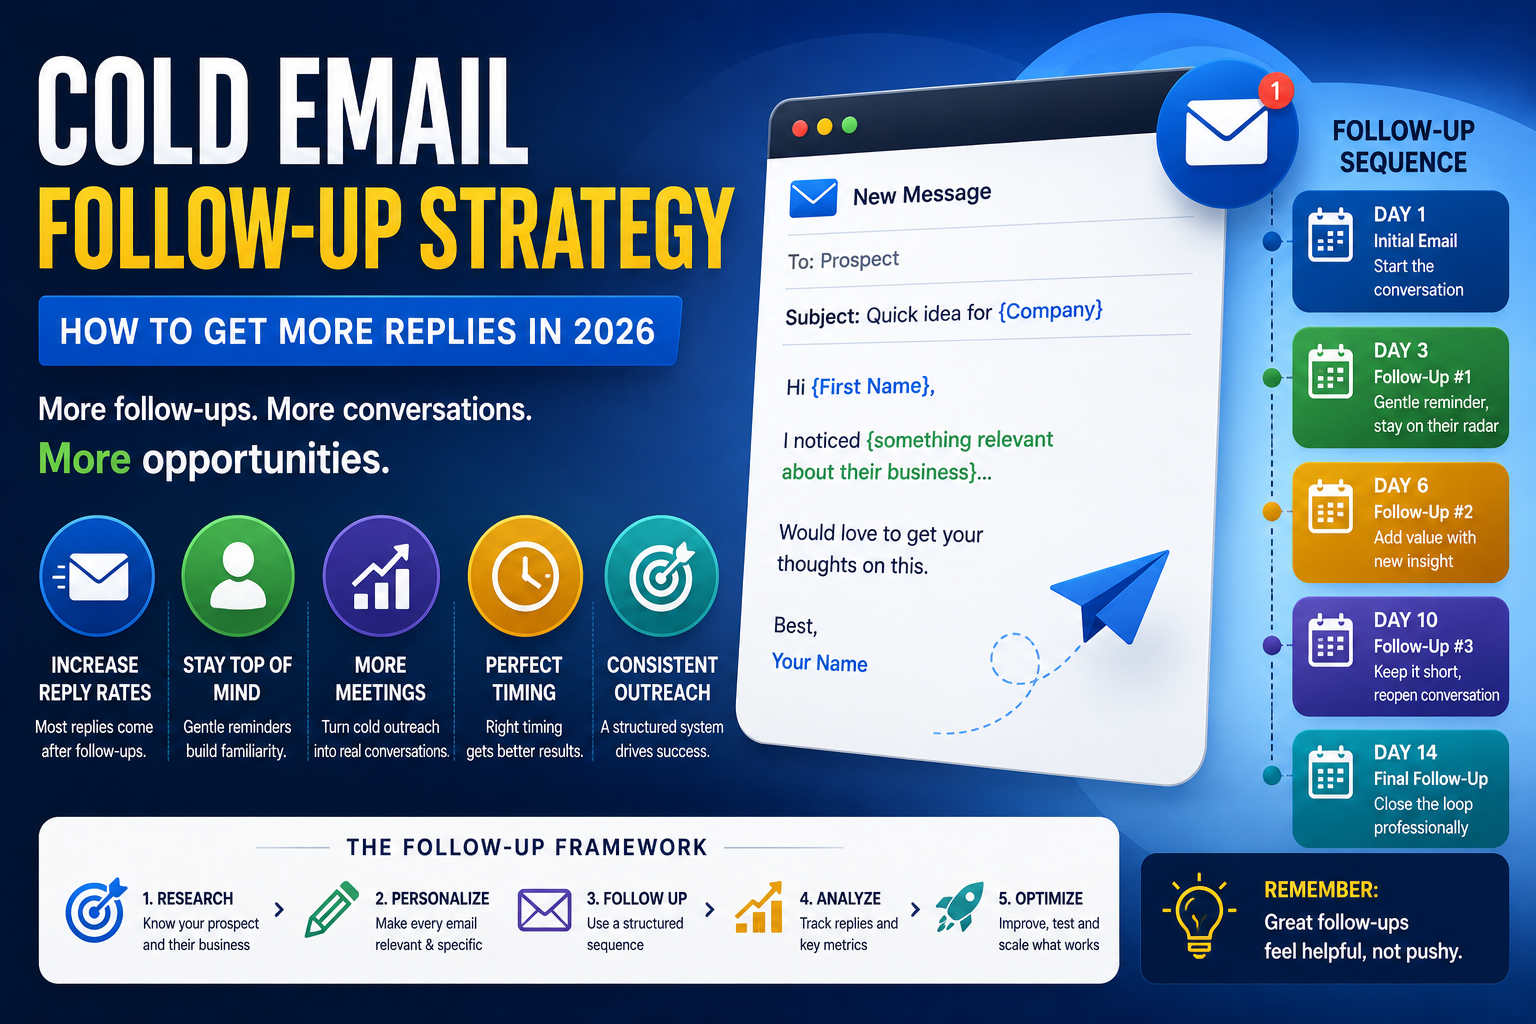
Some prospects won't respond to the first message, even if the offer is relevant. They may be busy, miss the email, or need more context before engaging.
A thoughtful follow-up gives them another opportunity to respond. It should add a useful angle or clarify the original reason for reaching out instead of repeating the same message indefinitely.
Track replies across the sequence, not just the first email, and make sure your reporting identifies which messages generated the responses.
How to Calculate Cold Email Performance Correctly
Consistent measurement is essential if you want to compare campaigns over time.
Use these formulas:
Reply rate
Unique replies ÷ delivered emails × 100
Positive reply rate
Positive replies ÷ delivered emails × 100
Meeting rate
Meetings booked ÷ delivered emails × 100
Bounce rate
Bounced emails ÷ emails sent × 100
For example, suppose you send 1,000 emails and 50 bounce. You receive 30 replies, of which 9 are positive, and book 4 meetings.
Your delivered volume is 950.
-
Reply rate: 30 ÷ 950 × 100 = 3.16%
-
Positive reply rate: 9 ÷ 950 × 100 = 0.95%
-
Meeting rate: 4 ÷ 950 × 100 = 0.42%
-
Bounce rate: 50 ÷ 1,000 × 100 = 5%
The bounce rate uses emails sent as its denominator, while the other three metrics use delivered emails. Keeping the denominators clear prevents misleading comparisons.
The bounce rate in this example is also worth investigating before sending another large campaign.
Why You Shouldn't Focus Only on Open Rates
Open rates have traditionally been used to judge whether a subject line is working. However, they have limitations.
Apple Mail Privacy Protection can prevent senders from reliably determining whether a recipient actually opened an email. Automated image loading and blocked tracking pixels can also affect reported figures.
Google also states in its sender guidelines that it does not track open rates and cannot verify the accuracy of open-rate figures reported by third parties.
That doesn't make subject lines unimportant. It means reported opens should not be treated as a perfect measure of human attention.
Use open-rate data cautiously, and prioritize metrics that more directly reflect your business goals:
-
Positive replies
-
Qualified conversations
-
Meetings booked
-
Opportunities created
-
Pipeline generated
If a subject line appears to increase opens but produces no improvement in relevant replies, it may not be improving the campaign in a meaningful way.
How to Improve a Low Cold Email Response Rate
When performance is disappointing, avoid changing every part of the campaign at once. Start with a structured review.
Step 1: Check the delivery data
Review bounce rates, authentication, spam complaints, and available reputation signals.
If there is a deliverability problem, resolve it before trying to improve the copy.
Step 2: Review the prospect list
Check whether the companies and contacts match your ideal customer profile.
Look for invalid addresses, outdated information, duplicates, and contacts who are unlikely to need your offer.
Step 3: Examine the offer
Ask whether the recipient has a plausible reason to care about what you're proposing.
If the offer is vague or unrelated to the prospect's situation, better wording alone may not help.
Step 4: Review the message
Check whether the reason for reaching out is clear, the email is easy to understand, and the next step is appropriate.
Remove unnecessary company background and unsupported claims.
Step 5: Segment your results
Compare performance across different industries, job roles, company sizes, and offers.
An overall reply rate can hide important differences. One audience may be responding well while another contributes most of the negative replies.
Step 6: Test one meaningful change
Test a different subject line, offer, audience, or opening approach while keeping the other major variables as consistent as practical.
Give the test enough data to be informative. Small samples can produce large percentage swings from just one or two replies.
Step 7: Evaluate the entire funnel
Don't stop at the reply rate.
Review whether the campaign generates positive responses, qualified conversations, and meetings. Use those outcomes to decide what to change next.
How to Benchmark Your Own Campaigns
External benchmarks are useful for context, but your own historical performance is often the more relevant comparison.
Suppose you run three campaigns targeting similar prospects with the same offer.
| Metric | Campaign A | Campaign B | Campaign C |
|---|---|---|---|
| Delivered emails | 900 | 950 | 920 |
| Replies | 18 | 29 | 32 |
| Positive replies | 5 | 10 | 13 |
| Meetings booked | 2 | 4 | 6 |
Campaign C has the highest reply rate, the highest number of positive responses, and the most meetings.
That gives you a stronger basis for investigation than reply rate alone.
You can review what changed between the campaigns: the audience, list quality, message, timing, offer, or follow-up approach.
One caution: if several variables changed simultaneously, you may not know which one caused the improvement. Record your campaign changes so you can make better decisions next time.
Over time, this creates a benchmark based on your own audience and business rather than a generic industry average.
Common Mistakes That Hurt Cold Email Results
Some problems are easy to overlook because they appear to be small execution details.
Sending to a broad audience: A message designed for everyone rarely feels specific to anyone.
Treating all replies as positive: Negative responses can inflate your reply rate without producing sales opportunities.
Increasing volume too quickly: More sending can magnify list-quality and deliverability problems.
Changing everything at once: You may improve the numbers without learning what actually worked.
Overusing personalization tokens: A first name or company name doesn't replace relevant research.
Ignoring follow-ups: Some interested prospects need another opportunity to engage, but follow-ups should remain relevant and respectful.
Relying on open rates alone: Reported opens can be distorted by privacy protections and tracking limitations.
Comparing incompatible benchmarks: A median campaign reply rate and a platform-wide average aren't the same measurement.
Avoiding these mistakes won't guarantee a particular response rate, but it will make your campaign data more useful and your decisions more informed.
What Should You Aim for in 2026?
A 5% reply rate can be a strong result for a targeted campaign, but it shouldn't be treated as a requirement for every B2B business.
Published data illustrates the range. Woodpecker reports a 1.5% median across its recent campaign dataset and a 3.43% platform-wide average in a separate historical analysis. The difference reinforces why benchmark definitions and time periods matter.
Rather than setting a target based on a single headline number, establish a baseline for your own campaigns.
Then work toward improvements in the areas that matter most:
-
Reaching the right decision-makers
-
Maintaining accurate prospect data
-
Making the offer relevant
-
Writing clear, natural messages
-
Maintaining healthy deliverability
-
Generating positive replies
-
Turning qualified conversations into meetings
Your ideal target should reflect the audience you're contacting and the results your business needs.
Final Thoughts
Cold email response rate is a useful metric, but it is only one part of the picture.
A campaign with a modest reply rate can still perform well if it generates relevant conversations and qualified meetings. A campaign with a high reply rate may be much less useful if most responses are negative.
Start by measuring your results consistently. Understand where prospects are dropping out of the process, and make changes based on what the data actually shows.
Most importantly, don't confuse sending more emails with building a better outbound system.
The real goal is not to collect the highest possible number of replies. It's to start meaningful conversations with prospects who have a genuine reason to consider your offer.